Free data visualization plugin
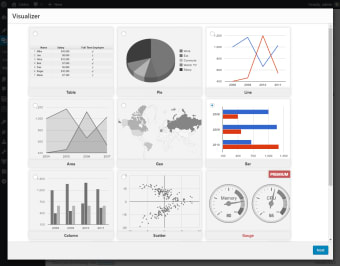
Visualizer is a free table and charts plugin for WordPress that lets you add new visuals for your data. It uses specific APIs for animated charts, graphs, and other aids so that your site’s visitors can absorb the information more easily. It works well across all known browsers for desktop, while it’s responsive on mobile devices.
There are several options you can customize and extend, allowing for flexibility and added functionality. You’ll also find integration support for Gutenberg blocks so that you don’t have to stress about how to add it during post editing. However, most of the advanced functions are hidden in the Premium version. Similar plugins include WPForms: Survey and Polls Addon, Formidable Forms, and wpDataTables.
Add charts and graphs for your data
Presenting tables and charts on your posts is a fantastic way to present data to your audience. While Gutenberg blocks do allow some functionality, it’s usually limited to HTML coding or it looks too basic. Visualizer helps animate and provide decent data visualization to give your information a pleasant display.
Customize the appearance
You don’t have to settle for default graphs and charts with Visualizer. There are various settings you can adjust so that they can match your site’s theme. It will impress your audience, and many developers may wonder which theme you used to make it look like that.
The customizations aren’t challenging to perform, as you’ll select which settings you want to change in the menus.
More options in Premium
When it comes to more advanced features, you’ll need to pay for the Premium version. For instance, you’ll be able to transfer information from other graphs and charts into yours on the site with the click of a few buttons. You can craft private charts so that members can access them with the correct permission. There’s even a function to automatically create visuals from your WordPress posts.
Better data presentation
Visualizer is excellent for WordPress sites that handle loads of data you want to present to your audience. Whether you deal with finances, markets, or research, it will compile your information into charts and graphs that stand out.
An extra benefit is that you can customize it to fit well with your site’s themes.